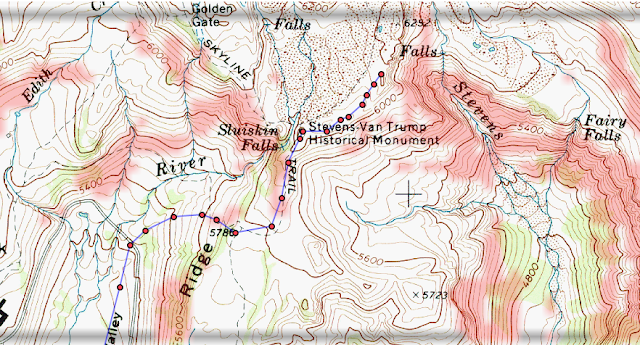
Hillmap features a suite of tools you can use to measure and visualize slope on topo maps. We use these tools to help us find the best line to ski, scout for cliffs (especially when we know there is climbable granite in the area), choose a likely camping spot, and check out trails before we hike them.
Slope at a single point
The most basic tool for measuring slope is the Point tool. Place the point on the map, and the slope will appear at the top of the screen on the Points tab.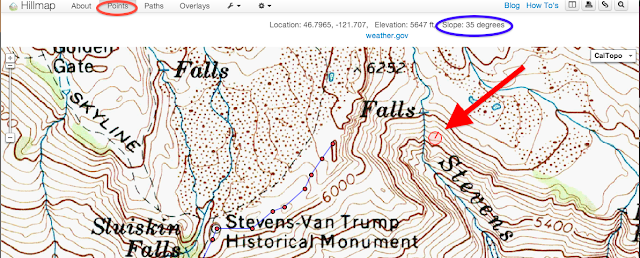 |
| Red circle: Points tab Blue circle: The slope of your point printed at the top of the screen Red arrow points to the point that is measured |
Step 1: Navigate to the Points tab.
Step 2: Place the point where you want to measure slope. If you zoom in, the red point on the map looks like a circle, with the radius line pointing in the steepest direction.
Step 3: Look at the top of the screen for information about the point, including slope.
Hillmap Slope Tool
The Hillmap slope tool creates a layer for your topo map that highlights slopes of a certain steepness. The angle is customizable, but defaults to highlight slopes that are greater than or equal to 30 degrees.A hillmap slope layer looks like this:
The red shading on the map are the areas that have a 30 degree slope or greater. All of the other areas on the map have a slope of less than 30 degrees. I used this map as one tool in plotting a route that minimized avalanche danger.
Step 1: Navigate to the Overlays tab
Step 2: Selecte the Data Overlays drop down menu and then select Custom Slope Analysis.
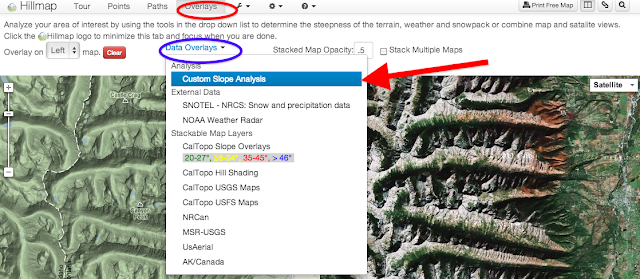 |
| Red circle: Overlays tab Blue circle: Data Overlays drop down menu Red arrow: Custom Slope Analysis |
Step 4: Hit the Analyze on Screen Area button. Hillmap will run the algorithm (it may take a moment) and then the slope layer will be overlayed on your map. This feature works best if you are zoomed in on a particular area about 10 miles on a side, and then zoom in further to see greater detail on the map. If you are too far zoomed out, the function does not work.
Caltopo Slope Layer
Caltopo map layers are created by Matt Jacobs, who began this project to create better maps for Search and Rescue in California, and now has coverage for the entire US. The Caltopo Slope Layer automatically highlights slopes in seven different categories: slopes from 27 to 29 degrees, slopes from 30 to 31 degrees, slopes from 32 to 34 degrees, from 35 to 45 degrees, from 46 to 50 degrees, from 51 to 59 degrees, from 51 to 59 degrees and greater than 60 degrees.The map layer looks like this:
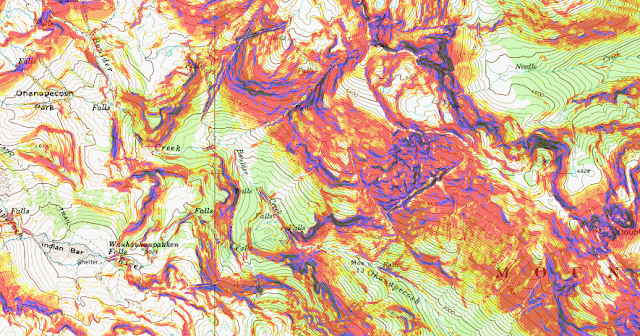 |
| The key to the slope layers is in the Add Overlays drop down box on the Overlays tab |
Step 1: Navigate to Overlays Tab
Step 2: Click on the Layers drop down box and select Caltopo Slope. You may have to wait a moment for the map layer to load, but it will do this automatically.
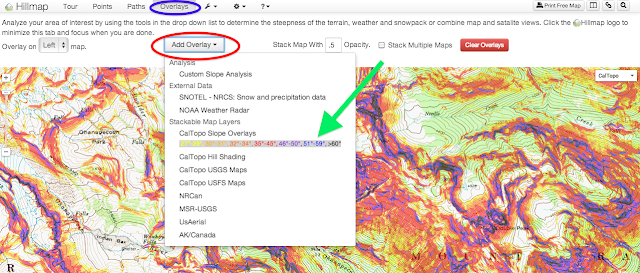 |
| Red oval: Add Overlays dropdown menu Blue oval: Overlays tab Green arrow: Caltopo Slope overlay selection and key |
Slope Analysis in Action
I use the slope tools all the time. Right now Ryan and I are thinking about buying a house, and I shamelessly use the point tool to check out how steep driveways are. I have used the tool heavily over the winter to find ski lines that are exciting but minimize avalanche danger (hillmap slope tools are not a substitute for safe avalanche practices and there is no warranty that using hillmap will keep you safe). I'd love to hear how other people use this tool!Here's a photo taken on our traverse of Mazama Ridge on Mount Rainier. The map used in this blog post is of that traverse.
Click on the View in Hillmap link on the map below to play around with the slope tools for the Mazama Ridge area. The photo was taken facing Mount Rainier from about the 5786 elevation notation on the map (we were probably standing somewhere near where the 7 or 8 appears). Take a look at the left side of the photo, of the scraped out avalanching cliffs: this is the steep area just about where the 5400 notation is on the map. If you use the slope analysis tools in hillmap you will see that the slope is indeed greater than 30 degrees.


25 comments:
I know at least one way to write great theoretical framework. On https://essayclick.net/blog/theoretical-framework you can read helpful info I use.
What are ways to copy and paste on a Chromebook
We are in a world where everyone wants to use shortcuts while using laptops or desktops.
https://youtu.be/w7jRbVjBv8A
https://communityfornorton.wordpress.com
https://v8webroot.wordpress.com
I think what same day essay reviews will help to become the best in the class, in writing written works, and this is an assistant, since even essays, term papers will be written on it, parents will obviously be proud of you
Vous êtes arrivé jusqu'ici et je pense que c'est formidable, continuez à poursuivre vos rêves et un jour vous atteindrez le sommet et vous verrez à quel point vous êtes devenu formidable. pge outage map
Geometry Dash Lite - This synchronization of music and gameplay creates an engaging and immersive experi
One of the highlights of Block Blast is that there is no time pressure. Players can think and execute their moves freely, without being limited by the speed of the game.
I find Doodle Jump to be the perfect game for short breaks. Its quick session length allows me to jump in and out easily. Whether I have a few minutes between tasks or waiting for an appointment, Doodle Jump is my go-to game for a quick dose of fun!
Have you reached the point where you are prepared to put your knowledge of the English language and your cultural competence to the ultimate test? Download the connections game, also known as the Word Puzzle Game, right now and get ready to go on a journey of linguistic discovery and mental strength that will make your life extraordinary!
Understanding terrain slopes is crucial for planning your next outdoor adventure, and Hillmap offers three intuitive ways to analyze them. Whether you prefer gradient shading, contour intervals, or 3D visualization, Hillmap has you covered for navigating tricky slopes and identifying safe routes.
Speaking of adventure, why not take a moment to explore new thrills? Check out Rocketplay registration to unlock a world of entertainment and exciting opportunities. Happy exploring—both on the map and beyond!
Music discovery is easier with Tubidy. The platform allows you to explore new artists and tracks without needing a subscription. It is a great place to find fresh music while saving your favourite downloads for later use. Everything is accessible without signing in or installing an application.
Hem görsel açıdan zengin, hem de kolay erişilebilir olması sayesinde, slotlar günümüz oyuncuları için vazgeçilmez hale geldi. Özellikle pinuplive gibi modern platformlar sayesinde bu oyunlar artık her yerde oynanabiliyo
Have you ever been “wrongly voted”? That’s what makes Among Us Online special – sometimes right or wrong is not as important as the ability to persuade! This game is not just about playing, but the art of communication and action psychology. Playing a lot will help you understand people a lot better.
Well, Incredibox is a godsend for adventure lovers like me! The Hillmap Slope Tool, with its ability to adjust the slope angle, is exactly what I need to hunt for couloirs or cliffs with the ideal slope.
That's a really clever use of topo maps! I mostly stick to well-worn trails, but I can see how valuable that would be for off-piste skiing or finding those hidden camping spots. Speaking of finding exciting routes, have you ever checked out Drift Hunters? It's not exactly the same, but it's a fun way to explore virtual terrain and find the perfect "line," albeit in a virtual car! I might need to try Hillmap for planning my next hiking trip, though.
I’ve used the Caltopo Slope Layer for backcountry camping Crazy Cattle 3D to find flat spots, and it’s a game-changer.
Wacky Flip combines physics-defying action, outrageous level design, and nonstop laughter into one of the most enjoyable mobile game experiences you’ll ever play.
Three ways to look at the slope of terrain in Hillmap is the best post that is providing us the best information about the slope of terrain, and we can learn from it. So I used moreton bay fig tree removal to get the best ideas and the services that are providing us the right results.
I’m impressed by how the Point tool provides precise slope measurements at specific locations, allowing users to make informed decisions about their outdoor adventures.
steal a brainrot
These slope analysis tools are incredibly useful for outdoor planning—it's like how growden io helps you map out the best growth strategies, Hillmap helps you navigate the terrain and find the optimal routes for your adventures!
These slope analysis tools are incredibly useful for outdoor planning—it's like how Stickman Empires helps you strategize the perfect terrain for your adventures, Hillmap helps you navigate the real terrain and find the optimal routes for your outdoor activities
The Hillmap slope tools are incredibly useful for outdoor enthusiasts, offering precise terrain analysis for skiing, hiking, and more. Whether planning adventures or practical tasks like driveway checks, it's a versatile tool. Looking for more excitement? Check out steal brainrots, the ultimate social heist simulator!
Forums highlight the power of shared knowledge and community. For those interested in exploring digital tools, latest version and discover resources designed for modern users.
This article provides excellent practical methods for terrain analysis, which is crucial for strategic planning. Interestingly, the core concept of positioning and defense translates well to games like PokemonTD. As a tower defense title, it requires similar tactical foresight, where managing your Pokemon team to counter incoming waves feels like strategically navigating a challenging landscape.
Post a Comment